What Is Average Position in Google Search Console?
A business owner opens two tabs. Search Console says their money keyword averages position 22. Their rank tracker says the same keyword sits at 42 on desktop. Somebody must be lying, and the monthly report meeting turns into a debate about whose number is real. Here is the uncomfortable resolution: both numbers are right, because they are measuring two different things. Once you know what each one actually counts, the disagreement becomes the most useful data you have.
We track rankings for a fleet of client sites and read the matching Search Console accounts every week, so we get to watch this exact collision on real data constantly. This post uses one account, a pool retailer we manage, measured both ways in the same week. The numbers disagree everywhere, none of them are wrong, and by the end you will know which one to trust for which decision.
- Average position in Google Search Console is the average of your site's topmost position across every search where it actually appeared, weighted by impressions. It only counts searches where you showed up, which quietly skews it toward your best results.
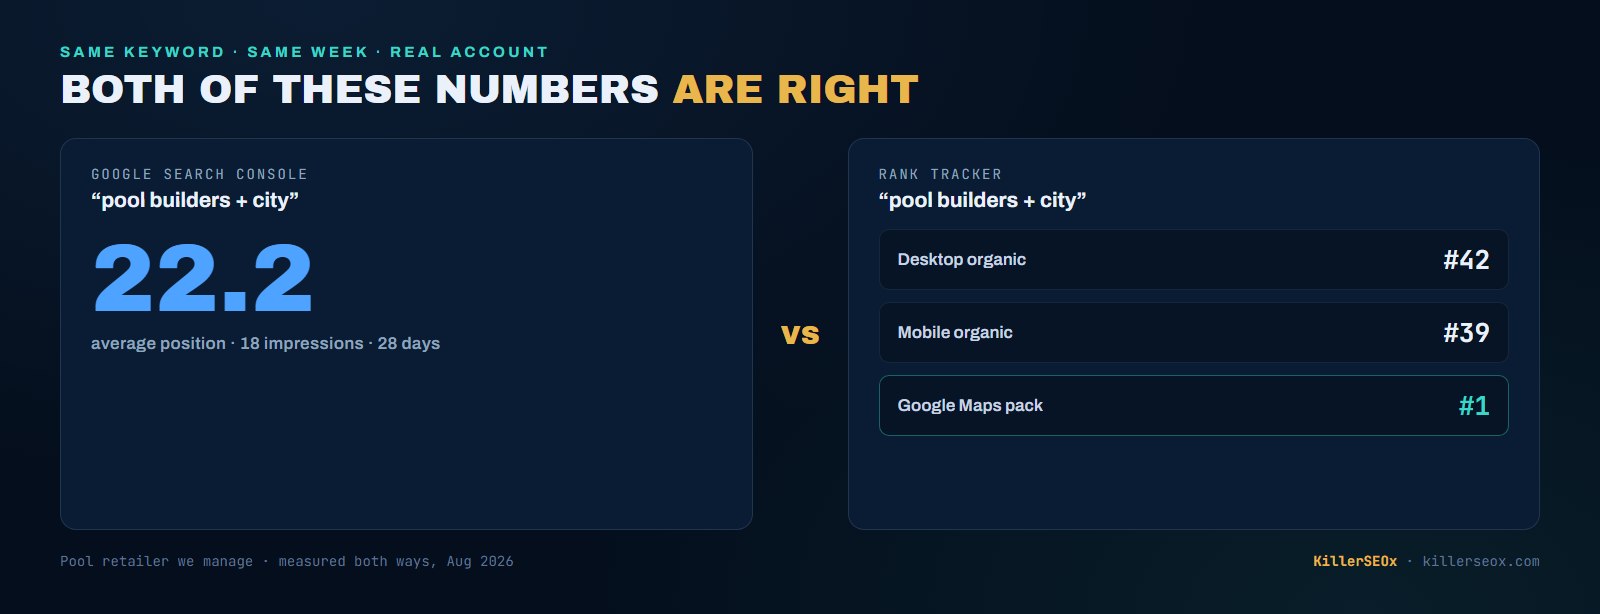
- A rank tracker asks a different question: where does this exact keyword rank from a fixed location on a fixed device today. Same keyword, one client, same week: Search Console said 22.2, the tracker said desktop 42, mobile 39, and #1 in the Maps pack.
- SERP features count. When your website link appears in the local pack near the top of the page, Search Console can record position 1 to 3 while your blue link sits at 40. The blend of the two is how you get a number that matches neither.
- A worsening average often means growth. New impressions arriving at position 40 or 60 drag the average the wrong way while clicks rise. The same account swung from 17.1 to 30.6 and back inside one month with no ranking collapse anywhere.
- Use Search Console to find queries and diagnose clicks. Use the tracker as the controlled instrument for the keywords you chose. Neither replaces the other, and the gap between them is usually the story.
What is average position in Google Search Console?
Average position is the mean of your site's topmost ranking across every search where it appeared, averaged over the queries, pages, devices, and dates in your filter. It counts only searches that produced an impression, records only your highest listing per search, and includes SERP features like the local pack when your link appears there.
Three details in that definition do all the damage, and most people reading the Performance report have never been told any of them.
It only counts searches where you appeared. If you rank 95 for a keyword, most searches never paginate deep enough to render you, no impression gets logged, and those invisible losses never touch your average. The metric is an average of your appearances, not an average of your rankings. That alone tilts every number in the report toward your best days.
It records your topmost result per search. If your service page ranks 8 and your blog post ranks 31 on the same query, that search contributes an 8. The 31 does not get averaged in. Two listings on one page count once, at the better spot.
It counts SERP features, not just blue links. A website link inside the local pack, an image result, a sitelink: if your URL renders anywhere on the page, that is an impression at that block's position on the page. A local pack sitting above the organic results records like a top-3 position even when your classic listing is on page 4. Hold that thought, because it explains the single biggest tracker fight we see.
Why does Search Console disagree with your rank tracker?
Because a tracker measures one keyword from one pinned location on one device on a schedule, while Search Console averages every real searcher on every device everywhere you actually appeared, features included. One client's keyword shows 22.2 in Search Console and desktop 42, mobile 39, Maps #1 in the tracker. All four numbers are correct.
Here is the real example, pulled this week. The pool retailer we manage targets a classic "pool builders plus city" keyword. Our local rank tracker checks it from a neutral pinned location and reports desktop 42, mobile 39, and #1 in the Google Maps pack. Search Console reports the same query at an average position of 22.2 across 18 impressions in 28 days.
Twenty-two matches nothing the tracker said. It is not the desktop rank, not the mobile rank, not the pack. It is the blend: real searchers near the store seeing the local pack with the site's link high on the page, other searchers further away seeing only the deep organic listing, some on phones, some on desktops, averaged together into a number that describes the crowd rather than any single search. The tracker's job is the opposite: hold every variable still so Tuesday's number and Friday's number are comparable. I wrote up what happens to Maps rankings when you unpin that location, and the short version is that "your rank" varies street by street. Search Console averages over all of it.
The same account has a "hot tubs plus city" keyword at 8 on desktop and 12 on mobile in the tracker, while Search Console calls it 14.2. Fourteen matches neither device. It does not need to. Roughly a third of that keyword's real searchers are seeing a page laid out differently than the tracker's clean check, and the average faithfully reports the mess.
And sometimes the two agree by pure coincidence. This account's site-wide Search Console average over 28 days is 21.8. Its tracked-keyword organic average is also 21.8. Same digits, completely different math: one is impression-weighted across 30,215 appearances on hundreds of real queries, the other is a flat average of 30 hand-picked keywords checked from one location. The number the tracker adds that Search Console never cleanly shows: those same 30 keywords average 1.9 in the Maps pack, with 17 of 30 sitting at #1. That split, invisible inside a blended average, is the difference between "this account is mediocre" and "this account owns the map and needs organic work." I covered why that split decides where local customers actually click now in an earlier post.
Why did your average get worse when nothing dropped?
Usually because you got more visible, not less. New impressions arriving at position 40 or 60 pull the average toward them while clicks keep growing. Brand terms distort it the other way: one brand query at position 1.3 props up a site average that would look far worse without it. Segment before you panic.
The average-position graph punishes growth in the short term, and nobody warns you. When a new page starts surfacing for queries at position 50, every one of those fresh impressions gets averaged in at 50. Your reach expanded, your clicks probably rose, and your average position "got worse." The same account's daily site average swung from 17.1 on one August day to 30.6 on another, a 13-spot swing inside a single month, while clicks stayed in the same band all along. If you read that graph as rankings collapsing and recovering, you would be wrong twice in three weeks. I went deeper on this in why rankings move when nothing changed, but the average makes it worse because it moves even when no individual ranking moved at all.
Brand queries pull the same trick in the opposite direction. This retailer's brand name averages position 1.3 and delivers 180 of the account's 541 clicks in 28 days, a third of all traffic at a spot it will never lose. Fold that into the site-wide average and the whole account looks healthier than its non-brand reality. Strip the brand out and the real fight, the service keywords sitting in the 20s and 30s, stands in the open. Any time a site-wide average is the headline of an SEO report, ask what it looks like without the brand terms. The answer is usually the actual report.
Want both numbers on one screen?
KillerSEOx pulls your Search Console data and runs desktop, mobile, and Maps rank tracking side by side, so the blend and the instrument stop fighting. Run a free audit on your site in about 60 seconds and see where you actually stand.
Run a free auditWhich number should you trust?
Trust Search Console for what real searchers saw and did: queries, impressions, clicks, CTR. Trust the tracker for controlled position on the keywords you deliberately chose, split by desktop, mobile, and Maps. Search Console finds the opportunities. The tracker tells you whether the work you shipped moved them.
Search Console's superpower is that it knows things no tracker can: which queries you appeared for that you never thought to track, how many people saw you, and how many clicked. It is where you find striking-distance keywords sitting at position 8 to 20 with real impressions, the closest thing to free money in SEO. It is also where a click-through-rate problem shows itself: solid position, real impressions, almost no clicks means your title and snippet are losing the argument on the page.
What Search Console cannot do is answer "did the thing we shipped last month move this keyword." Its average blends devices, features, and searcher locations, and it re-mixes that blend every day as the query mix shifts. The tracker exists precisely because that blend is uncontrolled. Fixed keyword, fixed location, fixed device, on a schedule: when that number moves, the movement is real and attributable. When we publish a page targeting a keyword, the tracker tells us in plain terms what changed, and the split matters as much as the direction. A keyword stuck at 38 organic but #1 in Maps needs completely different work than one at 38 organic with no Maps presence at all. The blended average would report both as roughly the same mediocre number.
So the honest answer is both, for different sentences in the same report. "Searchers found us for 300 queries and clicked 541 times" is a Search Console sentence. "The keyword we targeted moved from 14 to 9 on mobile" is a tracker sentence. An SEO report built from only one of them is half a report.
How should you actually use average position?
Never read it site-wide without segmenting. Filter to one query and one page, compare 28-day windows, watch the 8 to 20 striking-distance band, and always pair position with CTR. Then let a rank tracker confirm the specific keywords you are working, split by device and Maps.
A short field guide, which is exactly the workflow our platform automates for every account:
- Filter before you read. A site-wide average is trivia. Position becomes a decision only at the level of one query or one page. Query plus page together is the sharpest view Search Console has.
- Compare like windows. 28 days against the previous 28, or year over year for seasonal businesses. A pool retailer's August is not its January, and a day-to-day position graph mostly measures query-mix noise.
- Live in the 8 to 20 band. Real impressions at striking distance are pages Google already respects that nobody clicks because they are not on top yet. That list is the highest-yield content work order there is.
- Read position and CTR as one number. Position 6 with a 1% CTR is not a ranking problem, it is a title problem. Position 40 with any clicks at all means the query is desperate for a better answer.
- Confirm with the instrument. When a query matters enough to work on, put it in the tracker and watch desktop, mobile, and Maps separately. The blend told you where to look. The instrument tells you whether you are winning.
That last step is the whole reason we built rank tracking, Maps grids, and Search Console into one platform with a free tier. The two numbers were never supposed to agree. They were supposed to be read together, and once they are, the argument in the report meeting turns into a plan.
Quick answers
What is a good average position in Google Search Console?
Does average position include the local pack and other SERP features?
Why is my average position different on mobile and desktop?
Can average position go down while my SEO is improving?