Grid Heatmaps vs a Single Maps Position: What a Local Rank Tracker Should Show You
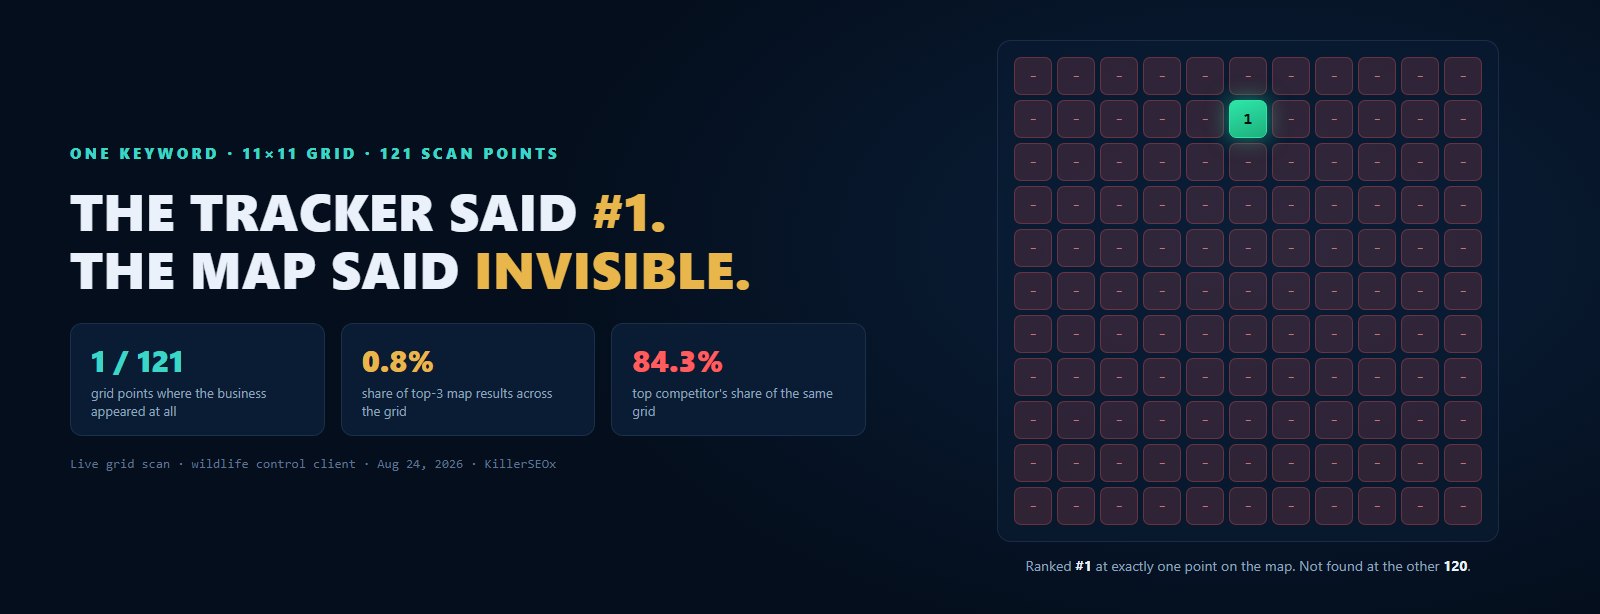
Last Sunday we ran a grid scan for a wildlife control company we manage. One keyword came back showing them ranked number 1 in Google Maps. That is the number a basic rank checker would have reported, and it would have been technically true. The scan checked 121 points across their metro. They appeared at exactly one of them.
Number 1 at one point on the map. Not found at the other 120. A single-point Maps check dropped at the right pin would call this business a market leader. The full grid shows a 0.8 percent share of the map while the leading competitor holds 84.3 percent. Same business, same keyword, same afternoon. This post is about that gap: what a single Maps position actually measures, what a grid heatmap shows instead, and the three numbers on a grid scan that tell you the truth about a local market.
- A single Google Maps position is one check from one pin. Proximity is a core Maps ranking factor, so the same keyword returns different rankings from different spots in town, and one number cannot represent all of them.
- In our August grid scan, one client ranked number 1 for a core keyword at exactly 1 of 121 points and appeared nowhere else. The single number said market leader. The grid said 0.8 percent of the map, with the top competitor at 84.3 percent.
- The reverse trap is real too: the same client ranks number 2 organically for a suburb keyword that never cracked the map results at a single grid point. Organic rank and Maps presence are separate scoreboards.
- Three grid metrics matter: coverage (how much of the map you appear on), average position including the points where you are missing, and share of top-3, the percentage of points where you actually make the pack.
- Averaging position 5 across a whole grid can still mean losing. Our client appears at all 121 points for one question keyword at an average of 5.15, and still holds only a 7.4 percent share of top-3 because the leader owns 96.7 percent.
What does a single Maps position actually measure?
One check from one pin. A single Maps rank is your position as Google renders the map results at one specific point, usually a city center or your own address. Move that pin two miles and the number changes, because proximity is a core Maps ranking factor. It is a sample, not a summary.
When a rank tracker reports "you are number 3 in Maps," there is a hidden clause: number 3 as seen from wherever the tool dropped its pin. Most tools check from the geographic center of the city you typed in. Your customers do not search from the geographic center of the city. They search from their kitchens, offices, and driveways, spread across thirty miles of suburbs, and Google hands each of them a map built around where they are standing.
We wrote before about how desktop, mobile, and Maps are three different rankings, and Maps is the strangest of the three because it does not even agree with itself. Organic rankings drift a few positions between locations. Maps rankings can go from number 1 to not-in-the-top-20 across one highway interchange. A single number flattens all of that into something that reads precise and measures almost nothing.
That is not an argument against tracking Maps. It is an argument against tracking Maps with one pin.
What is a grid heatmap?
A grid heatmap checks the same keyword from a lattice of points spread across your service area. An 11 by 11 grid is 121 separate checks, each colored by your rank at that spot. The result is a map of where you win, where you fade, and where you do not exist at all.
Instead of asking "where do we rank," a grid scan asks "where do we rank from here, and here, and here," 121 times, then paints the answers onto the map. Strong points show low numbers, weak points show high ones, and points where you never appear show nothing. The picture that emerges is your actual footprint in the market: usually a strong zone around your location that fades with distance, dented wherever a competitor's zone pushes back.
The scans in this post are 11 by 11 grids on a 30-mile radius, which covers a full metro service area. For a business that serves one town, a tighter grid with a 5-mile radius tells the same story at street level. The mechanics do not change: many pins, one keyword, one honest picture.
How can a business be number 1 and invisible at the same time?
Because both are true at different points on the map. In our August scan, one client ranked number 1 for a core service keyword at exactly one grid point out of 121 and appeared nowhere else. A single-point check at that spot reports a market leader. The grid reports a 0.8 percent share of the map.
Here is the scan that made me write this post. On August 24 we ran grid scans for a wildlife control operator we manage in a midwestern metro. One keyword paired their core service with a city at the northern edge of their service area. The scan found them at one single point, up in the corner of the grid nearest that city, ranked number 1 there. At the other 120 points they did not appear in the map results at all. Ninety-seven different competitors showed up somewhere on that grid. The strongest of them appears in the top three at 84.3 percent of all 121 points.
Now imagine the two rank reports. A single-point tracker with its pin near that corner says: number 1 in Google Maps. The owner frames it. A single-point tracker with its pin downtown says: not ranking. The owner panics. Both tools would be reporting the same market on the same day, and neither would be lying. They would just be standing in different places.
The same sweep held the opposite trap. For their service paired with a nearby suburb, this client ranks number 2 on desktop organic, a ranking any owner would read as "we own that town." The grid scan for that keyword never found them in the map results at any of the 121 points. Customers in that suburb who search and click through the map, which on commercial local searches is the surface that gets the click, will never see them. Organic and Maps are separate scoreboards, and being great on one buys you nothing on the other.
And one more, the subtlest of the three. For a "who is the best" question keyword in their metro, the client appears at every single one of the 121 grid points, average position 5.15. Sounds healthy. But the pack only shows three names, so position 5 is a spectator seat: their share of top-3 across the grid is 7.4 percent, while the market leader holds 96.7 percent. Present everywhere, chosen almost nowhere. No single number, not even an honest average, surfaces that.
Want to see your own map?
The free KillerSEOx audit checks your Google rankings, your Maps presence, and what six AI models say about your business, in about 60 seconds. No card, no trial clock.
Run my free auditWhy does your Maps rank change a mile down the road?
Proximity. Google assembles map results around the searcher's location, so your ranking is strongest near your business and decays with distance, while each competitor's ranking rises as the searcher gets closer to them. Competitor density, review strength, and category relevance decide how fast your zone fades.
Google's own documentation lists proximity alongside relevance and prominence as what ranks the local pack. Of the three, proximity is the one owners consistently underestimate, because it is invisible from your own desk. Search your service from your office and you will usually like what you see. You are standing in the middle of your own strong zone. Your customers mostly are not.
This is also why buying a rank report that says "number 1 in [city]" from any vendor should prompt one question: number 1 from where? A city is not a point. The wildlife client's grid makes that concrete: the same keyword, on the same day, was number 1 from one corner of the metro and completely absent from every other neighborhood asking.
Proximity cuts both ways, though. It fades with distance, but it does not go to zero because of distance alone. The 84.3 percent competitor on that grid covers points thirty miles apart. They out-rank proximity with prominence: years of reviews, a profile in exactly the right categories, and consistent citations across the directories Google trusts. We broke down what consistent citations are actually worth in an earlier post, and the grid is where that work shows up as territory.
Which numbers on a grid scan actually matter?
Three. Coverage: at how many points you appear at all. Average position counted across the whole grid, including the points where you are missing. And share of top-3: the percentage of points where you make the three-pack customers actually call from. One strong number out of the three does not mean a healthy market.
Grid tools throw a lot of acronyms around, but everything reduces to three questions. How much of the map am I on? That is coverage, found-at points over total points, and it is the number that exposed our 1-of-121 keyword. How high am I where it counts? An average position only means something when the points where you are absent count against it. An average that skips your dead zones told our client they were number 1. An average that includes them scored the same keyword 20.8 out of a 21-point scale. How often am I in the pack? Share of top-3, sometimes called share of local voice, is the closest thing to a revenue number a map can show, because the three-pack is what customers see and call. On that August sweep, six of the ten keywords we scanned had a zero percent share of top-3 anywhere on the grid. The best keyword managed 7.4 percent. That is the honest state of a market that a one-pin checker could have reported as "ranking number 1."
When those three numbers move together, you are actually gaining ground. When one moves alone, you have learned something more specific: coverage without top-3 share means you exist but never get chosen, and a great average at low coverage means you own your block and nothing else.
What should you do when the grid shows you losing?
Work the signals the map ranks on, aimed at the zones where you fade. Build out your Google Business Profile, keep reviews flowing with responses, fix citation inconsistencies, and give weak areas real location relevance with service and town pages. Then rescan monthly and watch whether your strong zone spreads.
A grid heatmap is a diagnosis, and the treatment maps to what the pack ranks on. Your Google Business Profile carries the most weight: exact primary category, services filled out, photos, posts, and a review ask wired into how you close every job. Citations feed Google's confidence in your data, and inconsistencies quietly cap your prominence. Reviews are the prominence signal you can influence fastest, both velocity and responses.
For the dead zones at the edge of your grid, pair the profile work with location relevance on your site. Real service and town pages for the suburbs you want, pages with actual local proof in them, give Google a reason to associate you with places beyond your pin. It will not beat proximity next door to a strong competitor, but it widens the zone where you are a credible answer.
Then measure it the same way you found it. Rescan the same keywords on the same grid every month and watch the shape, not just a number. This is exactly why we built grid scanning into our local rank tracker alongside desktop and mobile: a local business's real question is never "what is my rank," it is "how much of my market can see me, and is that growing." Every KillerSEOx plan, including the free tier, starts with that full picture instead of one pin.
Quick answers
What is a grid scan in a local rank tracker?
Why is my Google Maps ranking different in different parts of town?
What is a good share of local voice on a grid scan?
How often should you run a grid scan?